拡散モデルによる事後分布サンプリング
Langevin 拡散の時間反転を用いたシミュレーションベースのサンプリング法
2024-08-03
Python によるハンズ・オン
司馬博文
10/06/2024
(Vargas et al., 2023) の DDS (Denoising Diffusion Sampler) は変分推論のように逆 KL 乖離度を最小化することを通じて,一般の確率分布からのサンプリングを可能にする方法である.今回は 公式の実装 を吟味する.
A Blog Entry on Bayesian Computation by an Applied Mathematician
$$
$$
DDS (Denoising Diffusion Sampler) は (Vargas et al., 2023) によって提案された,雑音除去過程 (Denoising Process) を用いたサンプリング法である.
雑音除去過程に関しては次の記事を参照:
DDS については次の記事を参照:
本記事では 著者の GitHub を参照にして DDS の実装を吟味する.
funnel 分布(Neal, 2003) が slice sampling のデモ用に定義した 漏斗分布 を考える: \[ p(y,x)=\phi(y;0,3)\prod_{i=1}^9\phi(x_i;0,e^{y/2}),\qquad y\in\mathbb{R},x\in\mathbb{R}^9. \]
funnel() を定義import jax
from jax.scipy.stats import multivariate_normal
from jax.scipy.stats import norm
import jax.numpy as jnp
def funnel(d=10, sig=3, clip_y=11):
"""Funnel distribution for testing. Returns energy and sample functions."""
def neg_energy(x):
def unbatched(x):
v = x[0]
log_density_v = norm.logpdf(v,
loc=0.,
scale=3.)
variance_other = jnp.exp(v)
other_dim = d - 1
cov_other = jnp.eye(other_dim) * variance_other
mean_other = jnp.zeros(other_dim)
log_density_other = multivariate_normal.logpdf(x[1:],
mean=mean_other,
cov=cov_other)
return log_density_v + log_density_other
output = jax.vmap(unbatched)(x)
return output
def sample_data(n_samples):
# sample from Nd funnel distribution
y = (sig * jnp.array(np.random.randn(n_samples, 1))).clip(-clip_y, clip_y)
x = jnp.array(np.random.randn(n_samples, d - 1)) * jnp.exp(-y / 2)
return jnp.concatenate((y, x), axis=1)
return neg_energy, sample_dataimport numpy as np
import matplotlib.pyplot as plt
# ファンネル分布のサンプルデータを生成
neg_energy, sample_data = funnel(d=10)
n_samples = 10000 # サンプル数
data = sample_data(n_samples)
# 最初の2次元を抽出(yとx1)
y = data[:, 0]
x1 = data[:, 1]
# 散布図をプロット
plt.figure(figsize=(8, 6))
plt.scatter(y, x1, alpha=0.5, s=1)
plt.xlabel('y')
plt.ylabel('x1')
plt.title('Funnel Distribution (First Two Dimensions)')
plt.grid(True)
# xlim と ylim を追加
plt.xlim(-8, 8) # x軸の範囲を -10 から 10 に設定
plt.ylim(-7, 7) # y軸の範囲を -20 から 20 に設定
plt.show()
neg_energy, sample_data = funnel(d=2)

# y と x1 の範囲を設定
y_min, y_max = -9, 9
x1_min, x1_max = -8, 8
num_points = 1000  # グリッドの解像度

y_values = np.linspace(y_min, y_max, num_points)
x1_values = np.linspace(x1_min, x1_max, num_points)
Y, X1 = np.meshgrid(y_values, x1_values)

# グリッド上の点を作成
inputs = np.stack([Y.ravel(), X1.ravel()], axis=1)

# 対数密度を計算
log_density = neg_energy(inputs)
density = np.exp(log_density)

log_density = np.sqrt(density)

Density = log_density.reshape(Y.shape)

# 3Dプロットの作成
fig = plt.figure(figsize=(12, 8))
ax = fig.add_subplot(111, projection='3d')

# 軸のラベルを設定
ax.set_xlabel('y')
ax.set_ylabel('x1')
ax.set_zlabel('Density (Transformed)')

# サーフェスプロットを作成
surf = ax.plot_surface(Y, X1, Density, cmap='viridis', edgecolor='none')

# カラーバーを追加
fig.colorbar(surf, shrink=0.5, aspect=5)

# タイトルを設定
ax.set_title('Funnel Distribution Density on (x1,y)')

plt.show()
# 2Dヒートマップの作成
fig, ax = plt.subplots(figsize=(8, 6))

# pcolormeshを使用してヒートマップを作成
im = ax.pcolormesh(X1, Y, Density, cmap='binary', shading='auto')

# 軸のラベルを設定
ax.set_xlabel('x1')
ax.set_ylabel('y')

# カラーバーを追加
cbar = fig.colorbar(im, ax=ax, label='Density (Transformed)')

# タイトルを設定
ax.set_title('Funnel Distribution Density over y and x1')

plt.show()
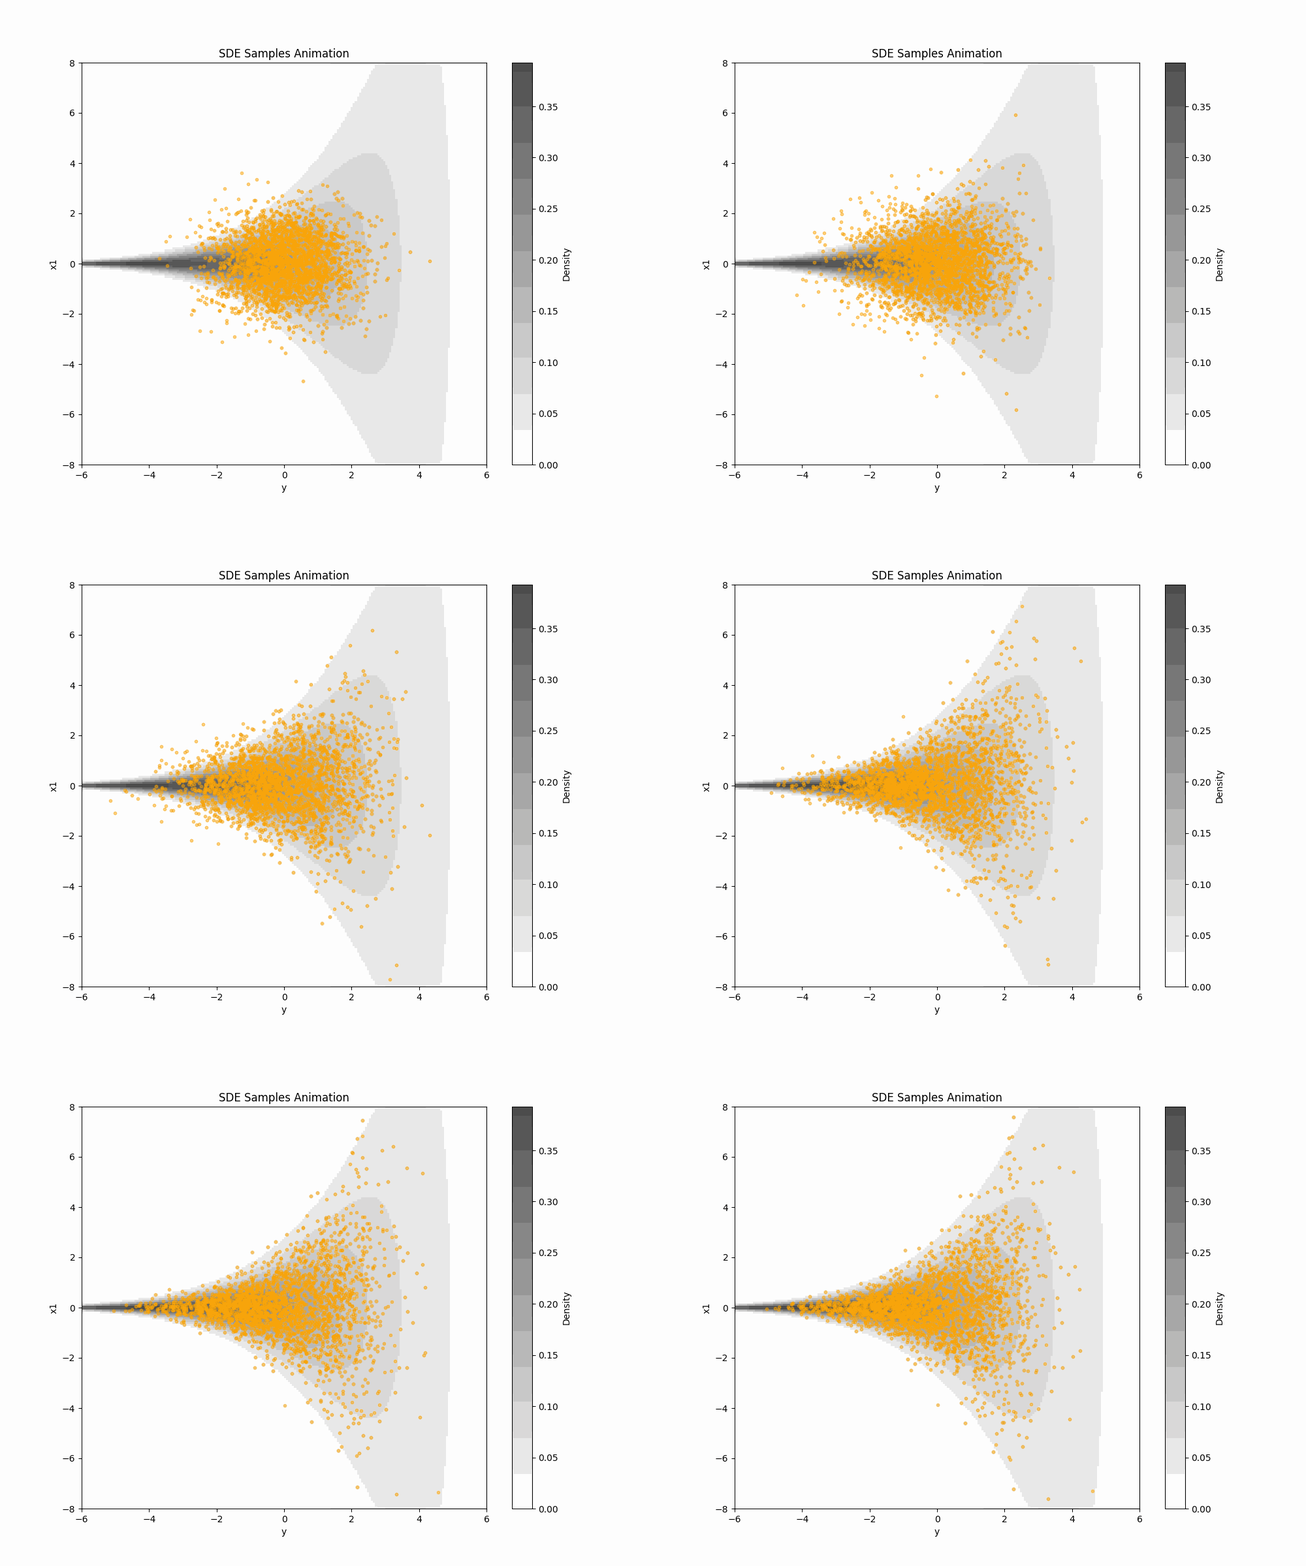
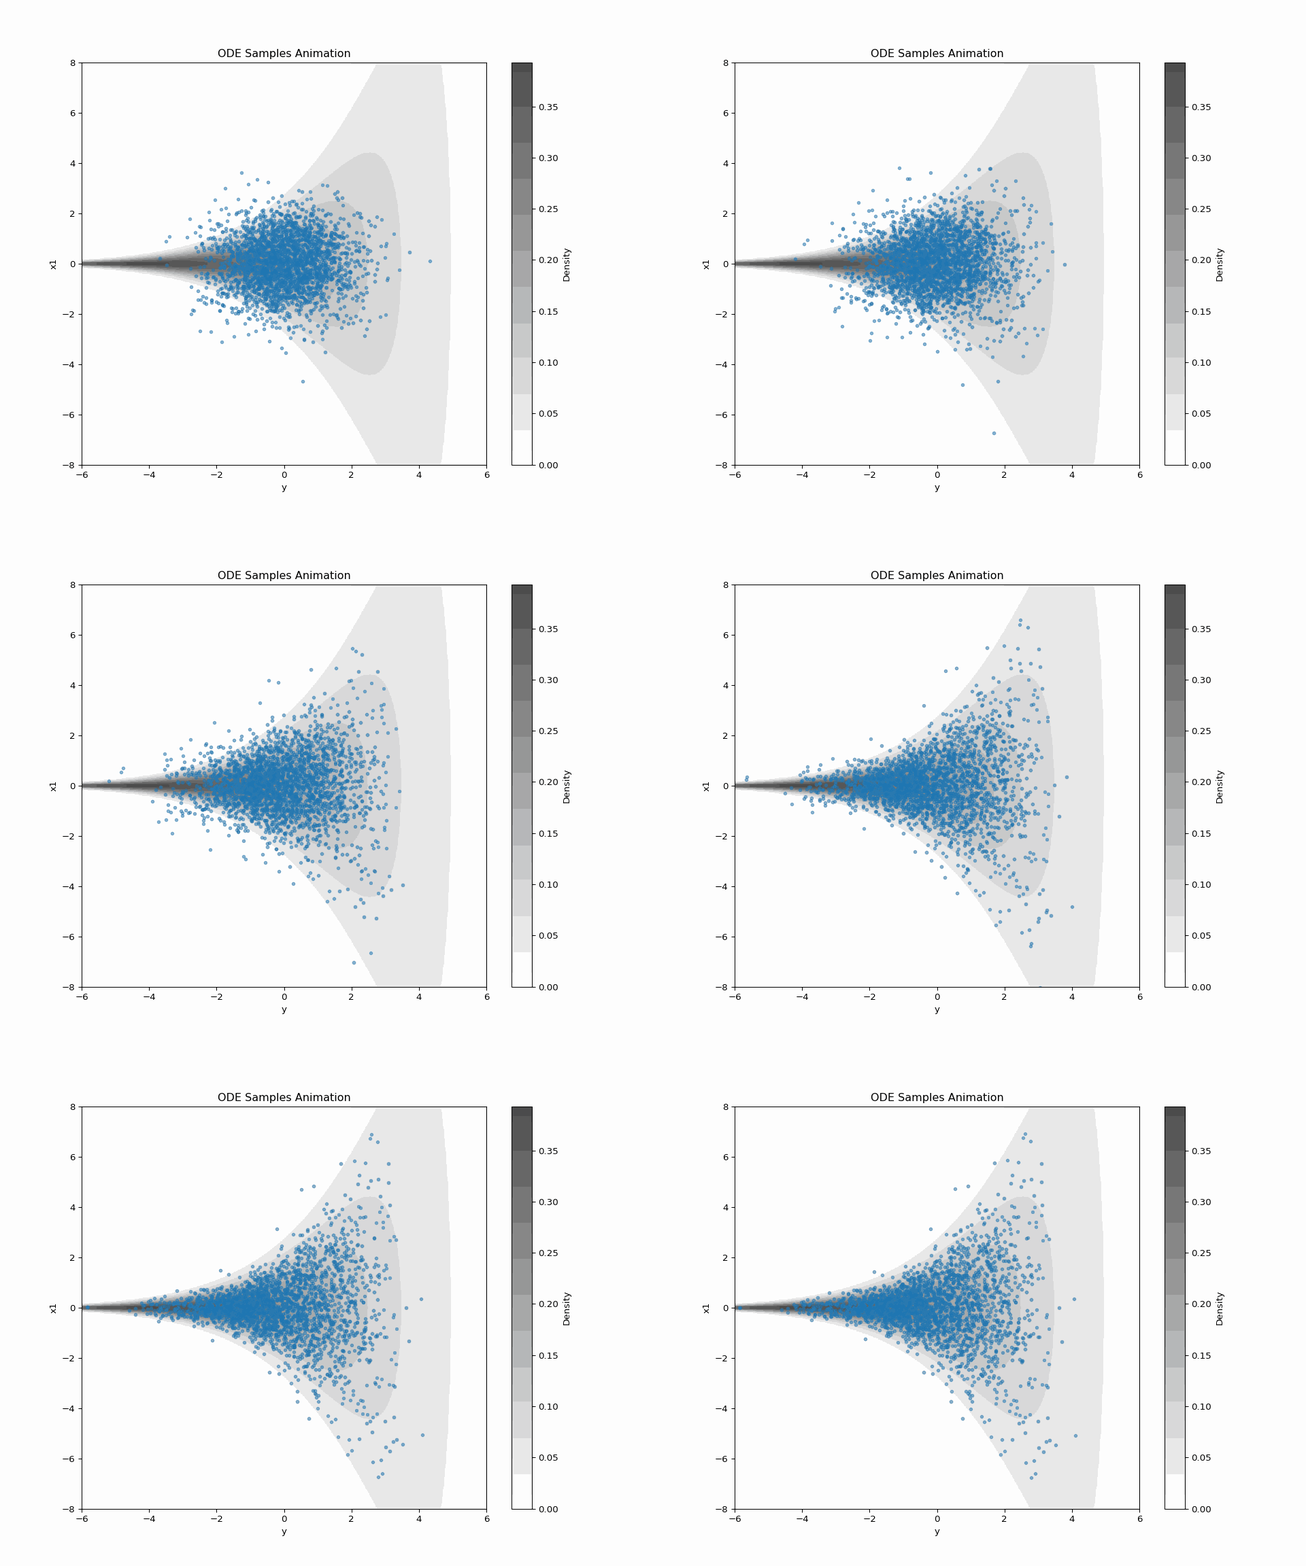
DDS を Funnel 分布からのサンプリングに適用してみる.
実際の実験は こちらの Colab で行なった.
途中で WandB (Weights & Biases) を使う.

import matplotlib.animation as animation

# Density のヒートマップ作成(前述のコードから)
neg_energy, sample_data = funnel(d=2)

y_min, y_max = -6, 6
x1_min, x1_max = -8, 8
num_points = 200  # グリッドの解像度を下げて処理を軽くする

y_values = np.linspace(y_min, y_max, num_points)
x1_values = np.linspace(x1_min, x1_max, num_points)
Y, X1 = np.meshgrid(y_values, x1_values)

inputs = np.stack([Y.ravel(), X1.ravel()], axis=1)
log_density = neg_energy(inputs)
density = np.sqrt(np.exp(log_density))
Density = density.reshape(Y.shape)

# プロットの設定
fig, ax = plt.subplots(figsize=(10, 8))

# ヒートマップを描画(Density.T ではなく Density を使用)
im = ax.imshow(Density, extent=[y_min, y_max, x1_min, x1_max],
               origin='lower', cmap='binary', aspect='auto', alpha=0.7)

# カラーバーを追加
plt.colorbar(im, label='Density')

# 初期データの取得
y0 = sde_data[:, 0, 0]  # y軸(第1次元)
x0 = sde_data[:, 0, 1]  # x軸(第2次元)
data0 = np.column_stack((y0, x0))

# 散布図を描画
scat = ax.scatter(data0[:, 0], data0[:, 1], s=10, alpha=0.5, color='orange')

# 軸の範囲を設定
ax.set_xlim(y_min, y_max)
ax.set_ylim(x1_min, x1_max)
ax.set_xlabel('y')
ax.set_ylabel('x1')
ax.set_title('SDE Samples Animation')

# 初期化関数
def init():
    scat.set_offsets(data0)
    return scat,

# フレームごとの更新関数
def animate(i):
    y = sde_data[:, i, 0]  # y軸(第1次元)
    x = sde_data[:, i, 1]  # x軸(第2次元)
    data = np.column_stack((y, x))
    scat.set_offsets(data)
    return scat,

# アニメーションの作成
ani = animation.FuncAnimation(
    fig, animate, init_func=init, frames=sde_data.shape[1],
    interval=50, blit=False)

# アニメーションの保存
ani.save('sde_animation.gif', writer='pillow', fps=20)
